Training yards
Work programmes, session notes, who rode what, and the weekly view an owner asks for on Friday afternoon.
Equine Data Analytics designs and builds mobile apps, web tools and websites for people whose working day starts in a stable. We turn whiteboards, diaries and device exports into software that riders actually fill in and owners can actually read.
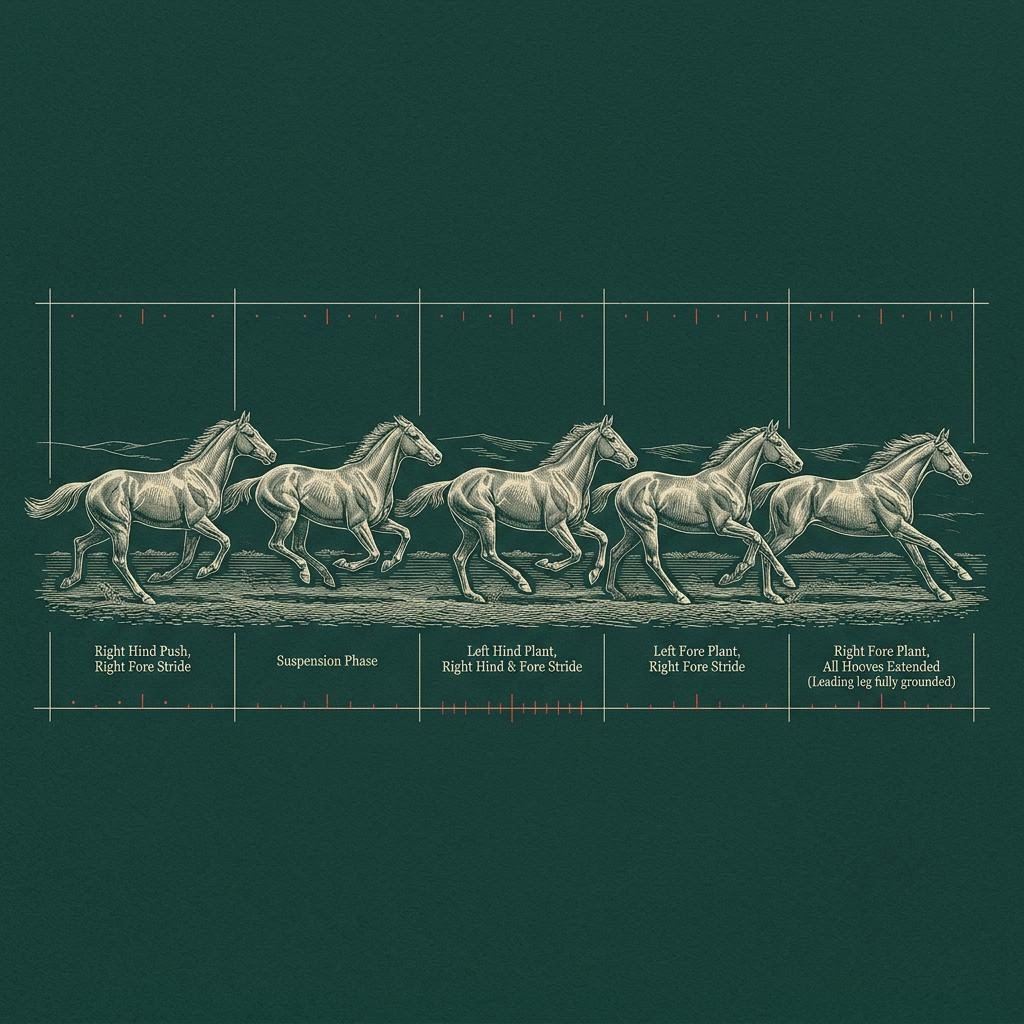
We are a software and digital services company. Our ordinary work is the same as any good studio: mobile apps, web applications, websites, interface design, publishing to the app stores and looking after what we ship. Our particular interest is the equestrian world, where information is often spread across a whiteboard in the tack room, three spreadsheets and somebody's memory.
We help organise that information, build tools around it and present it clearly. We do not offer betting or tipping services, and we do not interpret health data. Where your records touch veterinary matters, our software stores and displays what your professionals write; it never draws clinical conclusions.
| No. | Service | What you receive | Typically for |
|---|---|---|---|
| 1 | Yard and stud web appsBrowser software for daily records | Session logs, turnout and feed boards, per-horse history, exports to CSV, sign-in for staff. | Training yards, livery, studs |
| 2 | Mobile appsiOS and Android | Quick-entry apps that work offline at the gallops and sync later, with large controls for cold hands. | Riders, grooms, event stewards |
| 3 | WebsitesClear, fast, maintainable | Sites for clubs, competitions, rehoming charities and equestrian businesses, with editing you can do yourself. | Clubs, centres, organisers |
| 4 | Interface designResearch, flows, prototypes | Clickable prototypes tested with the people who will use them, before code is written. | Any of the above |
| 5 | Data dashboardsReadable, honest charts | Views that summarise workload and history from your own records, with plain notes on what each chart can and cannot say. | Yard managers, owners' updates |
| 6 | Publishing and supportRelease and care | App Store and Google Play submissions, hosting set-up, updates, fixes and a named support route. | Everything we build |
Most equestrian organisations do not need a large platform. They need one dependable place for the records that matter and a way for the right people to see them. Scroll sideways for the settings we design around.
Work programmes, session notes, who rode what, and the weekly view an owner asks for on Friday afternoon.
Mare and foal records, covering calendars and document storage, with careful permissions for sensitive notes.
Turnout rotas, lesson bookings handled by your chosen provider, and notices that reach clients without a group chat.
Membership websites, fixture lists, results pages and volunteer rotas that a new secretary can inherit.
Entry information, steward apps with offline timing notes, and results publishing that holds up on the day.
Before any meeting, it helps to know what material exists. This small check runs entirely in your browser. Nothing is sent to us.
Two more tools, a season record planner and a first-release sizer, are in the tack room.
Tick what exists today, however untidy. The score only describes how much raw material there is to build from.
Field software fails in predictable ways: no signal on the hill, a phone in a glove, a rider with thirty seconds between lots. We design for those conditions first. Entry forms save locally and sync later. Buttons are large. Defaults are remembered so a session can be logged with three taps.
On the office side, web apps give the yard manager a fuller picture: filters, histories, exports and a printable week. Both sides share one data model, so nothing is entered twice.
We ask to shadow a morning, in person or by video, and note every time information is written down or asked for.
A clickable prototype of one routine (logging a session, say) goes into real hands before anything else is designed.
Labels use your yard's vocabulary. Charts carry plain captions explaining what they show and what they do not.
Getting an app published is its own small project. We prepare store listings, screenshots, privacy disclosures and age ratings, manage TestFlight and Google Play testing tracks, and answer reviewer questions. For websites, we set up hosting, domains, certificates and a sensible backup routine.
Apps are published under your organisation's own developer accounts wherever possible, so you always own the listing. We explain each account you need and why.
Data from horses is noisy, partial and easily over-read. Our dashboards summarise what was recorded (distances, durations, workloads, notes) and say clearly what they cannot tell you. We do not build prediction tools for racing outcomes and we do not produce health assessments.
Every chart we design carries a caption with its source, its time window and its known gaps. That small discipline prevents most of the arguments a dashboard can otherwise start.
No. Some of the most useful projects are a single well-designed form and a weekly summary. We will say if a spreadsheet is still the right answer.
Often, if the device can export files such as CSV or GPX. We check a sample export early, before promising an import.
Yes. Most work happens remotely across the UK, with visits arranged where useful and agreed in advance.
No. We build software. Training and health decisions stay with you and your qualified professionals.
The most useful first message describes a single routine that wastes time today: who does it, where, and what happens to the information afterwards. We reply from analytics@equinedataanalytics.fyi during working hours.
Monday to Friday, 09:00 to 18:00, Europe/London.